Gathering information from different sources and combining them to display reports and graphs to our clients or organizations can be a tedious and time-consuming task. Google Analytics is a great tool for data analysis, research, and data discovery. But, when it comes down to building customized dashboards for your clients, Google Analytics is not flexible enough. It is estimated that marketers spend 10 to 30 hours a month on reporting. This time, when saved, can be used to focus on more important and interesting aspects of our clients’ accounts.

This is where Supermetrics comes to the rescue. Ever since it was released as an add-on for Google Sheets, Supermetrics has been the answer to data interpretation and visualization problems. Gone are the days when marketers used to spend hours importing and preparing excel reports from Google Analytics. Supermetrics is a powerhouse business analytics tool that brings all your metrics into one place and facilitates ease of analysis.
Supermetrics is a reporting automation tool that helps digital marketers pull all their PPC, SEO, social and web analytics data into one place including spreadsheets and data visualization platforms for reporting and analysis. Supermetrics is used by +400k marketers across the globe and is the #1 reporting automation tool for PPC, SEO, social and web analytics.
Supermetrics: Ease of Use
Multi-Channel Reporting
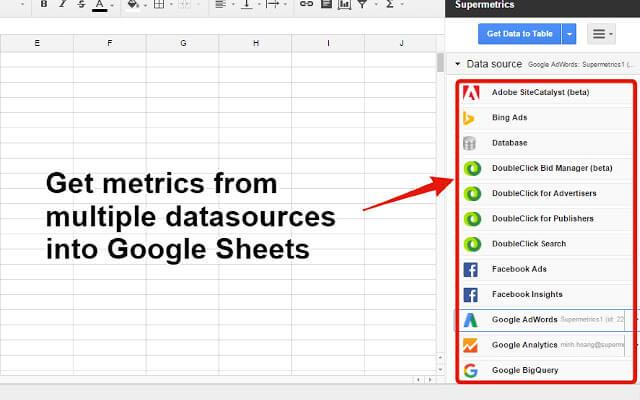
Supermetrics can be integrated with more than 40 platforms. Google Analytics, Google Ads, Facebook Ads and Insights, Bing Ads, Twitter are some of the common ones.
It helps marketers to pull out data from multiple channels into a single view and, thus, make way for faster analysis. Along with different channels, it can also pull data from different accounts associated with the same channel, for comparison (different client accounts under the same channel).
This is especially helpful when a client has multiple accounts for different locations and wants to track progress based on certain metrics for all the locations. What took hours earlier can now be done in under very less time with Supermetrics.
No More Manual Copy/Pasting or Importing CSV Files
For marketers, time is money. Ironically, it’s time consuming to log into each platform every day and collect the data to be presented to our clients. Especially, if you are expanding to new channels, it will only increase the time consumed.
Supermetrics makes the process much easier and faster with its highly flexible sidebar. Getting metrics for dozens of sites is just a matter of a few seconds as you only have to enter the required details and Supermetrics automatically fetches the data for you. This can save a lot of your precious hours and also improve the quality of presentation.
Supermetrics promotes minimal maintenance and maximum observation, which means, the time used to prepare a report, can be used in delivering value to the client.
PPC Reporting
With increasing client base and marketing channels, data reporting and visualization has become more challenging and time-consuming than ever. Integrating data from different advertising channels into the same excel sheet, updating them daily and comparing the results is a tedious process.
For
example, if you’ve multiple accounts for Bing Ads, and also use
different advertising platforms like Facebook Ads and Google Ads, the
amount of complexity and time involved in daily reporting of the data
can easily make you bang your head on the wall.
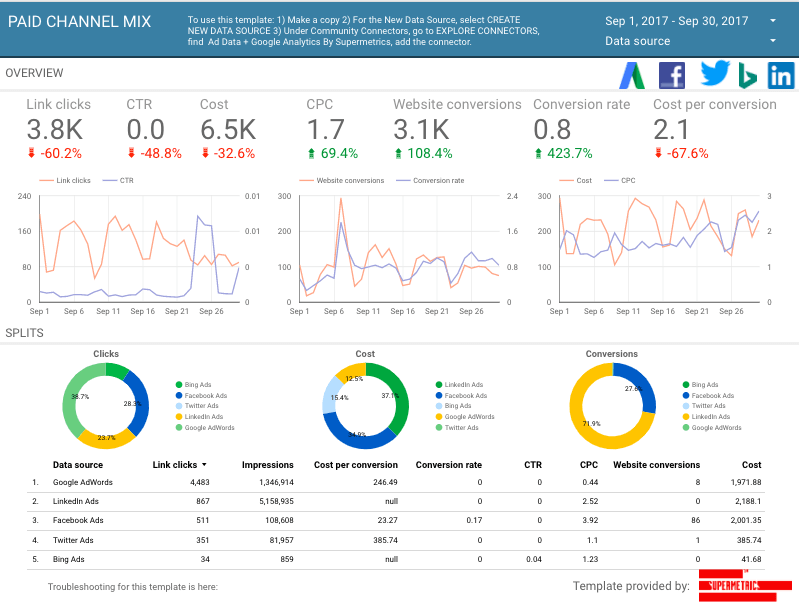
This is where Supermetrics comes as the prophesized savior, especially with its Google Sheets Add-On feature and Google Data Studio integration. It helps to build the same excel report with all the data comparisons and complex charts, with all PPC channel data in the same place.
With this, all the advertising data can be easily compared and the performance of one channel over the other can be analyzed almost effortlessly.
Track Daily Spend
If you are involved in online advertising, you know the pain of tracking daily ad spends for every client to ensure maximum ROI.
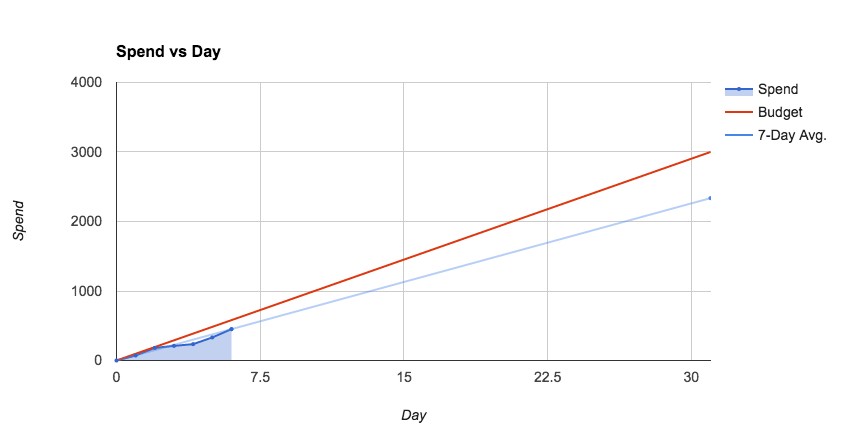
Once Supermetrics has pulled all the data on a spreadsheet, you can use data validation to create drop-downs and can flick through every client spend and how this is faring with the expected daily spend. This provides much more control over the tracking process and helps to quickly monitor all the client accounts. All you only have to do is select the required client account from the drop-down menu!
Performance Tracking
To ensure high ROI for each client, you can set dashboards and automate alerts based on when the performance dips below the expected level.
Any possibility of human error is, thus, eliminated by also ensuring client satisfaction. You can set alerts for performance, budgets and other metrics.
For example, you can set an alert when the bounce rate goes beyond a certain limit. This allows you to identify the possible causes and take corrective action before it’s too late.
Supermetrics Review: 5 Main Product Offerings
Supermetrics for Google Sheets is by far the most popular Supermetrics product. It allows you to automatically pull data from all your marketing platforms (Google Analytics, AdWords, Facebook, LinkedIn, Twitter and many others) into Google Sheets.
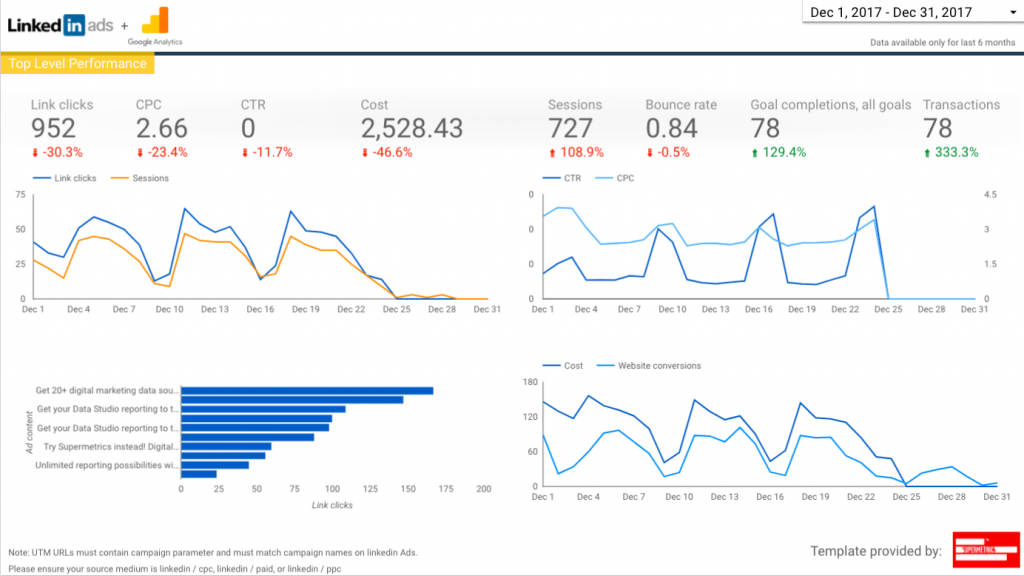
Supermetrics for Google Data Studio is the missing link to transfer all of your marketing data into Google Data Studio. By default Google Data Studio can only connect with Google services such as AdWords and Analytics.
Supermetrics Data Grabber allows you to pull all of your marketing data into Excel spreadsheets. However, compared to Supermetrics for Google Sheets, the number of data sources is limited.
Supermetrics Functions improves on the functionality of Data Grabber by giving you custom ways to display your marketing data in Excel.
Supermetrics Uploader connects with Google Analytics’ feature to upload advertising cost data. That way, Google Analytics can show cost data from all your advertising sources (not just AdWords).
Supermetrics Review: Features
Here are the list below of some of Supermetrics’ features:
- Data analytics
- Business intelligence
- Data mining
- Data visualization and presentation
- Search engine marketing (SEM)
- AdWords
- Report scheduling, forecasting, and automation
Setup manual
Supermetrics is a Google Sheets add-on. You can install it from the add-on store for free. Once you’ve installed it and granted the necessary permissions you can launch Supermetrics from the Google Sheets menu.
- Click on Add-ons – > Supermetrics -> Launch sidebar
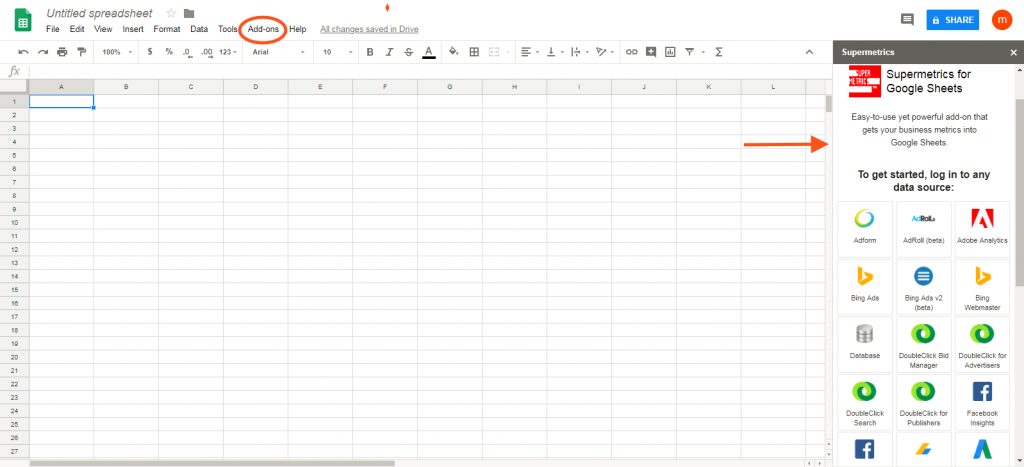
The sidebar will appear at the right-hand side of your Google Sheets documents.

The Supermetrics sidebar is where you configure your reports. It offers seven drop-down menus to setup your reports.
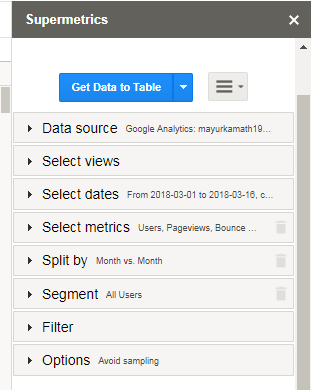
Data source: This is where you choose which platform you want to import data from. Some of the most common platforms would be Google AdWords, Google Analytics or Facebook Ads.
Select accounts: Once you have selected your platform, you have to select the account on the platform you have chosen. For example, most marketers have access to several Google Analytics accounts so you would specify which one you want to use for your report.
Select dates: This is where you specify the date range of your report. It can be a specific date range that doesn’t change or a relative date range like “last 30 days”.
Select metrics: These are the metrics that will be shown in your reports. Some of the most common would be clicks, impressions, cost, conversions etc.
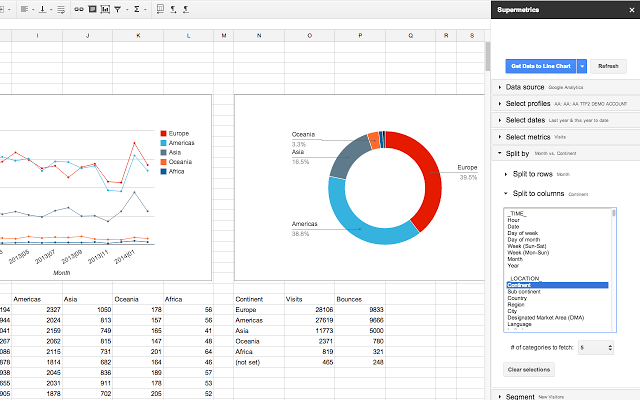
Split by: Here you decide how to split your data into rows and columns. For a time-based performance report you could for example show weekly performance results. In this case you would select “Year & week” under “split to rows”.
Filter: Filters are an important feature to limit your data to specific parts of your account. For example, if you are generating an AdWords report you might only want to include one or two of your campaign instead of the entire AdWords account.
Options: Options offers a few additional features that you might want to use in specific cases. For example, one useful feature is “No header row”. This will allow you to create your own custom headers in your Google Sheet instead of using the Supermetrics default headers for the data.
Supermetrics Review: Pricing
Supermetrics pricing is based on five subscription options: for Data Studio ($0 to $382.72 per month), for Google Sheets ($0 to $190.72 and higher per month), for Excel ($126.72 to $254.72 and higher per month), for BigQuery ($190 to $490 per month), and Supermetrics API (custom priced). The main differences between the plans are the number of license users, reports, and queries per day.
| Plans | Monthly Pricing* ($/Month) | Annual Pricing* ($/Month) |
| Supermetrics for Data Studio | $0 to $382.72 | $0 to $299 |
| Supermetrics for Google Sheets | $0 to $190.72+ | $0 to $149+ |
| Supermetrics for Excel | $126.72 to $254.72+ | $99 to $199+ |
| Supermetrics for BigQuery | $190 to $490 | N/A |
| Supermetrics API | Customized | Customized |
*Annual plans are paid in full at the start of the billing cycle.
There are additional functionalities for more extensive analysis, including Data Grabber (starts at $19 per month) for reporting, monitoring, and analyzing in Excel. Users can also integrate marketing data with Excel and Google Sheets reports with Supermetrics Functions ($29.99 per month). There’s an option to automate and schedule the upload of advertising cost data into Google Analytics through Supermetrics Uploader (starts at $39 per month).
Supermetrics Alternatives and Competitors List
1. Google Analytics
Google Analytics now makes the features that experts demand easy to use for everyone. Gain rich insights into your website traffic with Advanced Segmentation, Custom Reporting, Motion Charts, and more. Learn more about where your visitors come from and how they interact with your site. You’ll get the information you need to write better ads, strengthen your marketing initiatives, and create higher-converting websites. Learn more about the benefits. Google Analytics is free to everyone, whether you are an advertiser, publisher, or site owner.
2. Whatagraph
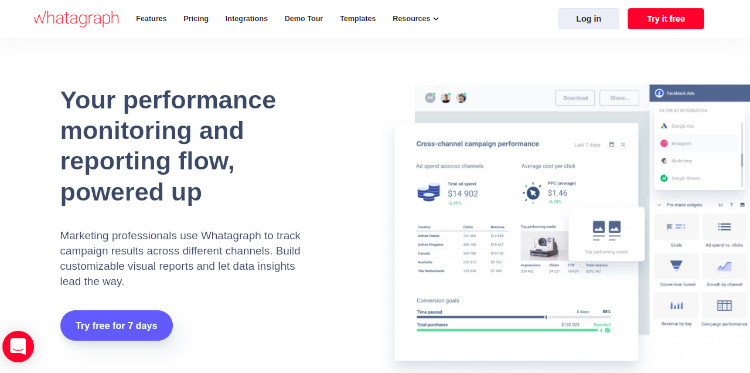
Digital marketing agencies and businesses use Whatagraph to save time and present analytics data in a way their clients and teams can easily understand.
What users get:
- Data from all your digital channels in one platform
- Customisable and editable visual templates
- Automated report generation and e-mail delivery
- Flexible date range reporting
- Several languages available
3. Crystal Reports
SAP Crystal Reports software is the de facto standard in reporting. With SAP Crystal Reports, you can create powerful, richly formatted, dynamic reports from virtually any data source, delivered in dozens of formats, in up to 24 languages. A robust production reporting tool, SAP Crystal Reports turns almost any data source into interactive, actionable information that can be accessed offline or online, from applications, portals and mobile devices.
4. SeoTools for Excel
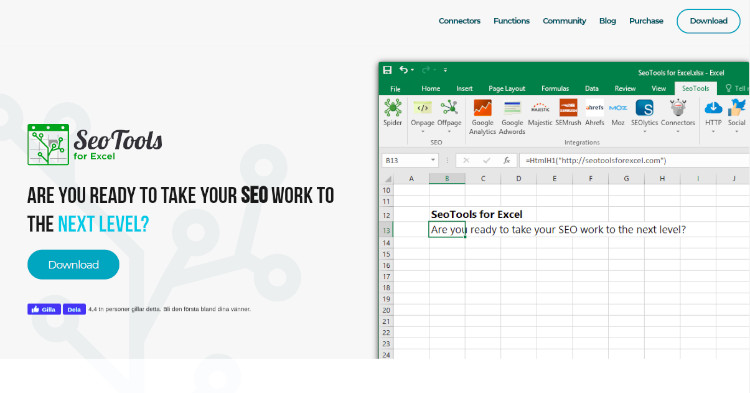
SeoTools for Excel integrates popular services such as Moz, Google Analytics/Search Console, Majestic, and makes extraction of data and evaluation of links/domains/keywords super-fast and effective with the Excel formula-based environment. SeoTools also comes with a wide range of functions which enhances your Excel experiences and makes you a SEO-Ninja!
5. ReportGarden
ReportGarden helps online ad agencies create analysis and performance reports for their clients. We do this by linking with their AdWords, Analytics, Bing Ads accounts using APIs and loading data into their reports. Our customers can now slice and segment the data on the fly to show analysis in the form visualisations.
ReportGarden offers Dashboards, CRM, Project Management Tool, Analytics, SEO, Budget Tracking and Invoices along with Client Reports. The product offers deep segmentation and filtration of the data from all the ad services (AdWords, Analytics, Bing ads, etc). We stitch together the data from these services automatically to make it easy for account managers to create complex analysis reports.
For example, they stitch together information from AdWords and Analytics to show keyword level bounce rate this week compared with the previous week. If you try to do this using excel, you will need to download sheets from Google Analytics and AdWords. Then you have to combine the two sheets followed by trying to split data by week. Using that split data you prepare visualisations.
Summing Up
Supermetrics is an all-round business intelligence software that is tailored to meet the specific needs of online marketers. It greatly simplifies the process of data analysis and through automation, saves a lot of our precious time.
However, the use of the products depends on your overall ability to use spreadsheets. Also, sometimes there is a possibility of data getting pulled into the wrong columns (which can be solved by selecting the right columns and refreshing the query). So, you need to stay alert and proceed with analysis only if the data makes sense to you.
The downsides are minor when compared to the amazing benefits offered by Supermetrics. With its flexibility and frequent updates, Supermetrics provides the required edge that is vital to the growth of an agency or organization. With features like easy integration with multiple data sources, ease of data visualization and real time data analysis, Supermetrics is a must-have tool in every online marketer’s toolbox.
If you are not working with clients Supermetrics is still a great tool to create reports for analysis and optimization purposes. You can use Supermetrics to get access to performance data on AdWords, Facebook and Analytics more easily which in turn helps you optimize your campaigns faster.
In conclusion, if you are regularly spending time on creating reports for clients or reports for analysis and optimization purpose, Supermetrics will help you save a lot of time while providing deeper performance insights.
If you are still not sure whether Supermetrics is right for you, just use their 14-day free trial to test it out.
Our 'Handpicked' Tools for Internet Mareters
- Native Advertising Software Tool: Brax, Anstrex
- Facebook Advertising Software Tool: Audiencer, Revealbot, Connectio,
- Social Media Advertising Software Tool: SproutSocial, SocialBee,
- Internet Marketing Software Tools: Semrush, SproutSocial,

I and my team research various media buying platforms and can help you choose the right network; so you could rake in more greenbacks with an increased ROAS. I am just a mail away, so reach out to me if you need assistance with scalable media buying. mail: [email protected]