Whatagraph is a marketing performance reporting solution that can help simplify your analytics and reporting tasks using automatic data visualization functionality. It can instantly transform social media and website content into robust yet simple and clear infographic reports. It supports multiple integrations; you can assign responsible users to clients, group your reports by clients or departments, set unique branding to each client & pay for what you need and many more features that definitely will take your reporting to the next level.

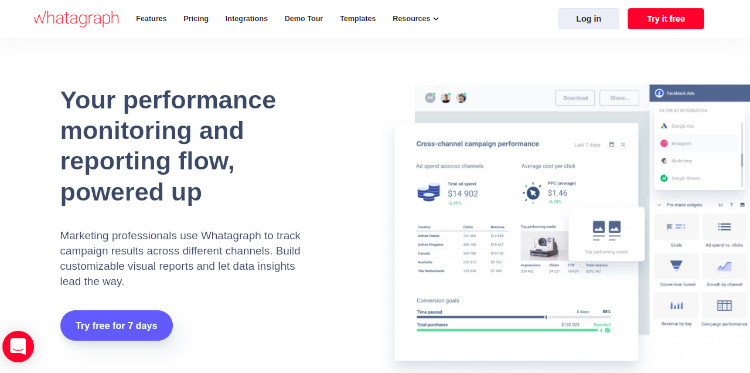
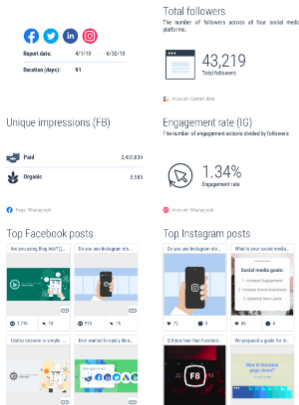
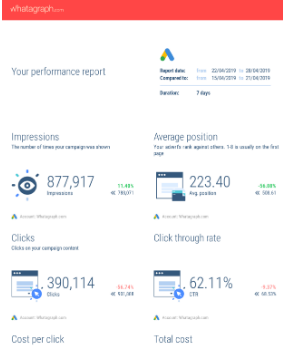
Whatagraph is a system that provides modern businesses with a fresh and very visual way to present analytics data in various forms that people can easily ingest and comprehend. More than just bars, graphs, and charts, Whatagraph displays analytics data in an infographic style of reporting that is a whole lot better than the graphs you see in Google Analytics.
The software features automated data gathering capability that allows it to automatically collect data from over 10 data sources, including Facebook, Twitter, LinkedIn, Instagram, YouTube, Google Analytics, and more. Once you have the data you need, Whatagraph lets you create custom templates to make sure that your data is visualized exactly the way you want it. On top of that, you can embed branding elements into your reports for added personalization. Whatagraph automatically generates the reports and then sends them to your recipients (partners, clients, stakeholders, etc.) for hassle-free distribution.
Whatagraph Review: Product Features
The best features are listed below:
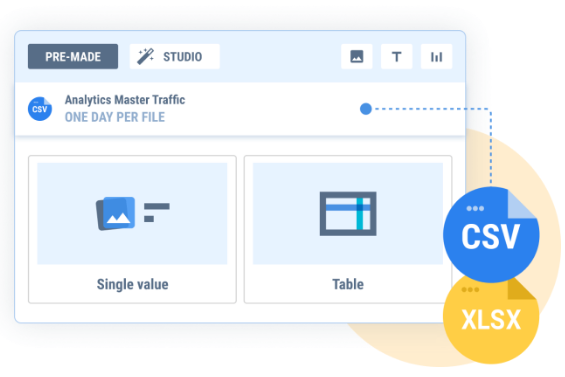
- Data Visualization
- Data Automation
- Custom Data Reporting
- Data Source Centralization
- Integration
Statistical Analysis Features
- Association Discovery
- Compliance Tracking
- File Storage
- Forecasting
- Multivariate Analysis
- Regression Analysis
- Statistical Process Control
- Statistical Simulation
- Survival Analysis
- Time Series
Marketing Analytics Features
- A/B Testing
- Campaign Tracking
- Channel Attribution
- Customer Journey Mapping
- Dashboard
- Performance Metrics
- Predictive Analytics
- ROI Tracking
- Social Media Metrics
- Website Analytics
Whatagraph Review: Platform Look and Feel
Dashboard
The application provides a highly intuitive dashboard. This feature allows users to access sections of the application right from one single place.
You can access areas such as:
- Manage Accounts
- Subscription
- User Information
- Custom Reports, and
- Whitelabel
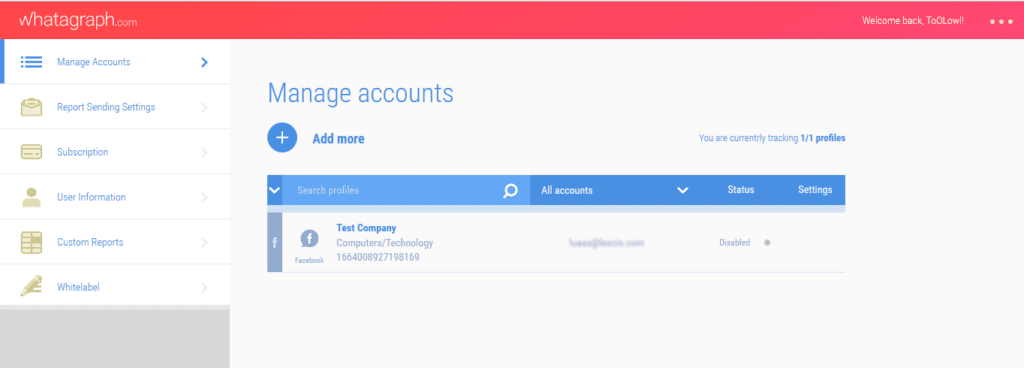
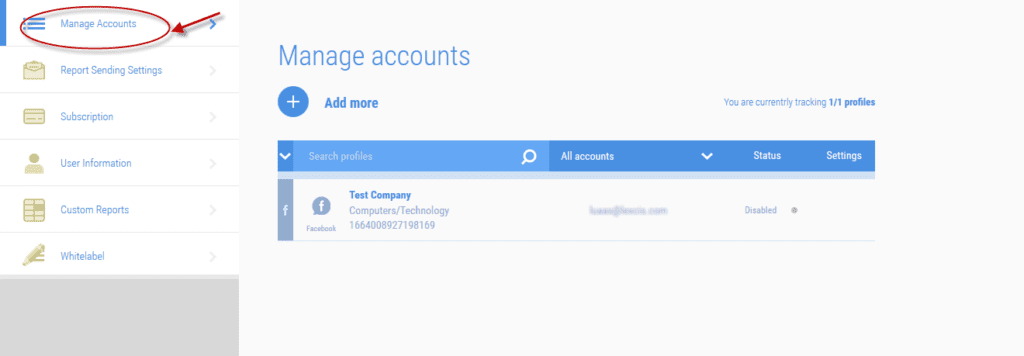
Manage Accounts
You can easily manage accounts that are connected with Whatagraph. This application is flexible to work with a number of applications, such as Google Analytic Site, Facebook Page, etc.
You can reset settings about when you wish to receive reports after the analysis. Whatagraph can also send you report right inside your inbox.
Custom Reports
This section helps you to get an insight into the performance of your online presence. Reports section provides default reports about how your website is interacting with the visitors. This section has two options for the same: Basic, and Pro.
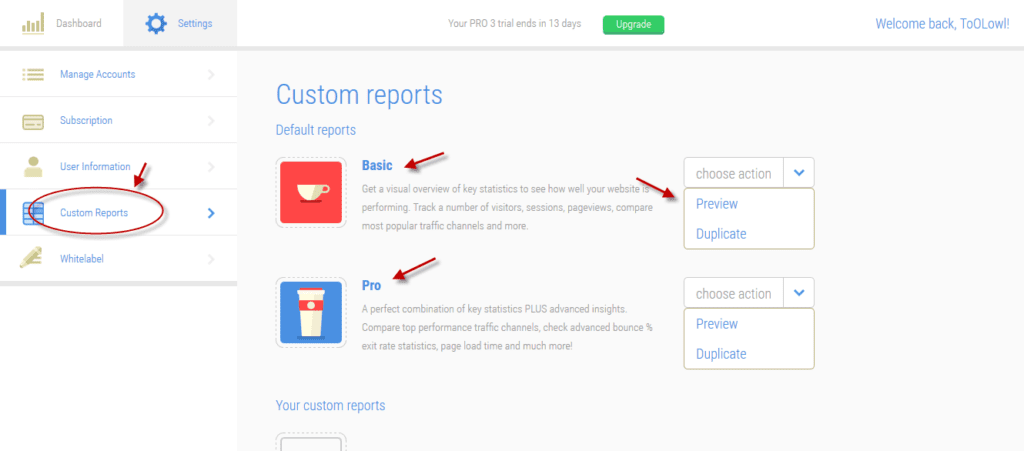
The Basic Plan offers a visual overview of key performance indicators about your website. This feature shows tracked the number of visitors, sessions, page views as well as helps you to compare and track most popular traffic channels. The Pro Plan, in addition to all above features, offers advanced insights about your website. This plan helps you to compare the top performance traffic channels, check advanced bounce % exit rate statistics, page load time and many more features. A Preview and Duplicate option are available for both of these reporting features.
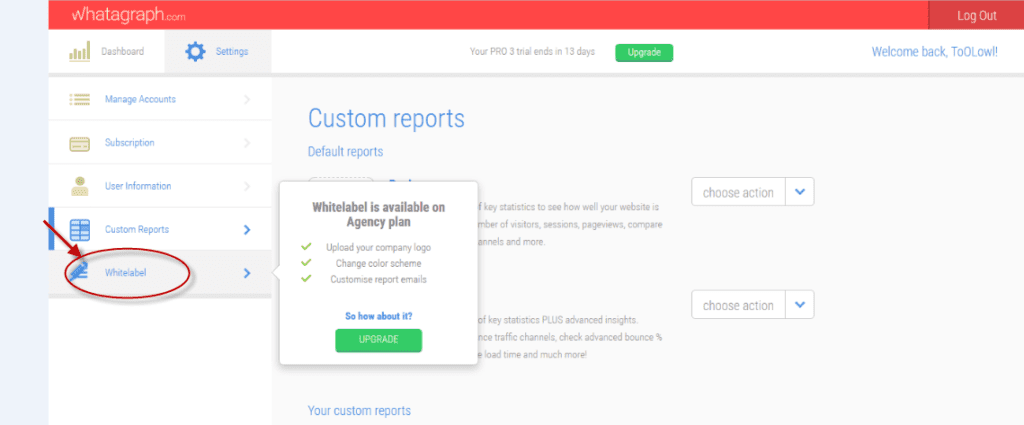
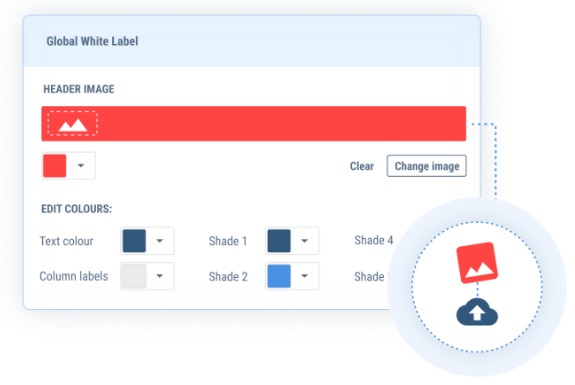
Whitelabel
This is an advanced feature and is only available for the Agency Plan. Under this plan, you can build your company profile and add features such as:
- Upload company Logo
- Change Color Scheme
- Customize report emails, etc.
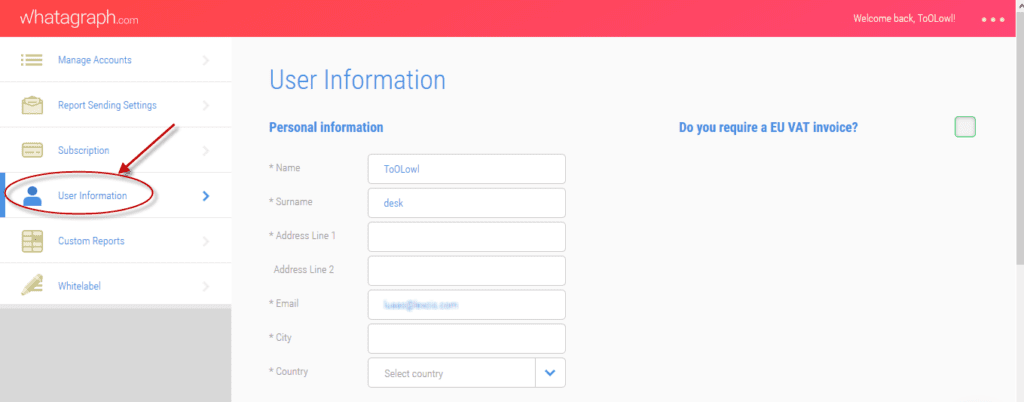
Update User Information
Once you start working with Whatagraph, you can update your profile. The application allows you to update details in the fields:
- Personal Information
- Company Details, and
- Change or Reset Password
Whatagraph Review: Ease of Use
Schedule automated marketing reports
Set up daily, weekly, monthly, quarterly or yearly automated reports to reach your clients email at the time you select.
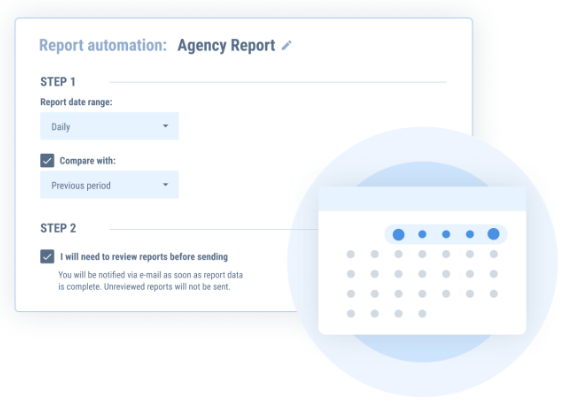
Always know how your automated reports are performing with report delivery summaries.
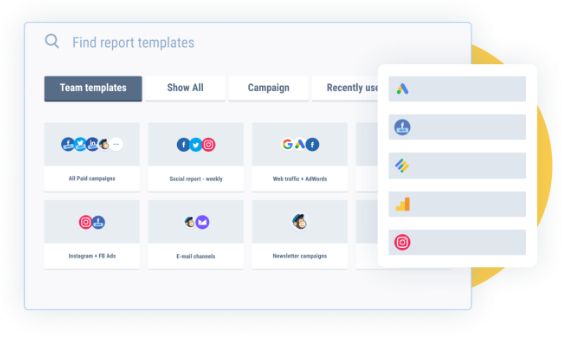
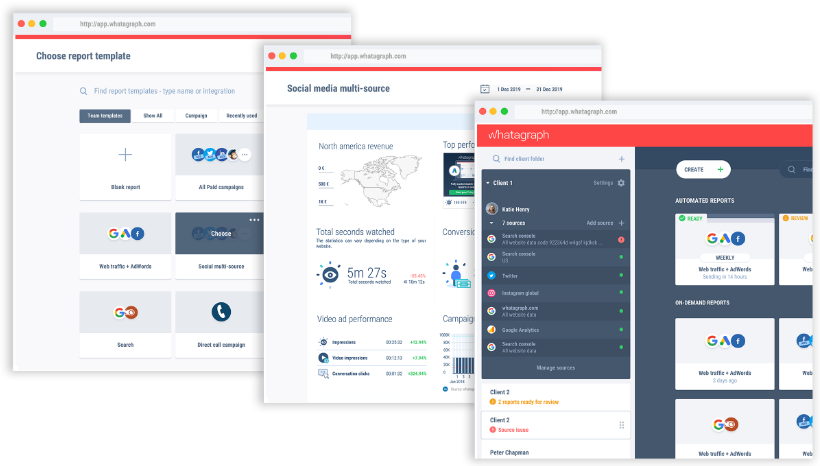
Create multi-source reports
Build a single report to see the performance of all your marketing channels. Compare different landing pages and marketing campaigns. Monitor how different landing pages performing in terms of visitors.
Easily
compare same metric for different data sources to see how different
landing pages are performing in terms of visitors, registrations,
sales and goal completion.
Use your own branding
Customize your reports with your own logo, custom colour schemes and send them from your own domain. With all Whatagraph branding removed, you can take all the credit to yourself.
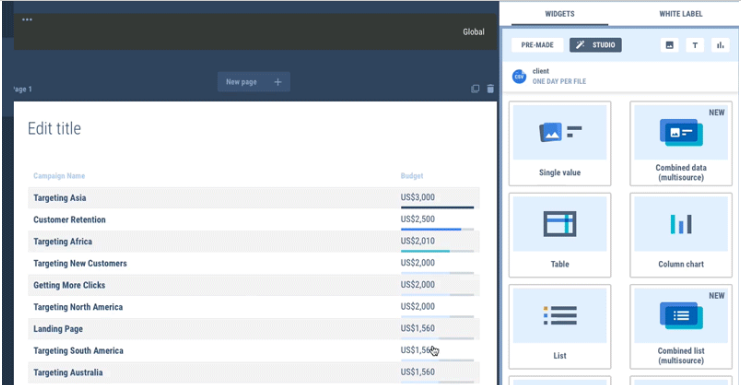
Upload images to your reports
Personalize with images – include your own insights for each marketing report.
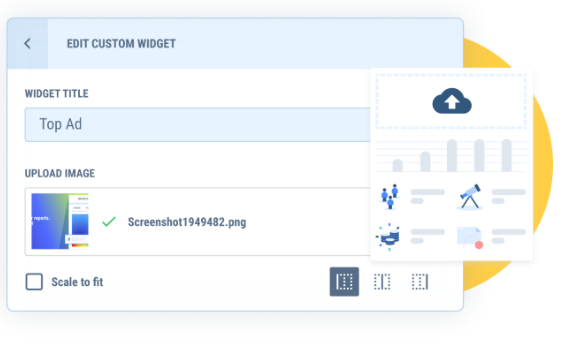
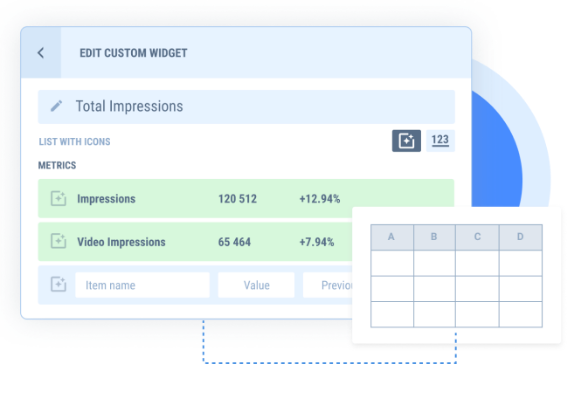
Include offline information with custom data widgets
With Whatagraph, you can easily insert your own custom data and visualise it using our infographic reports. Build a single report to visualise your business performance from customer acquisition to their activation, retention and revenue.
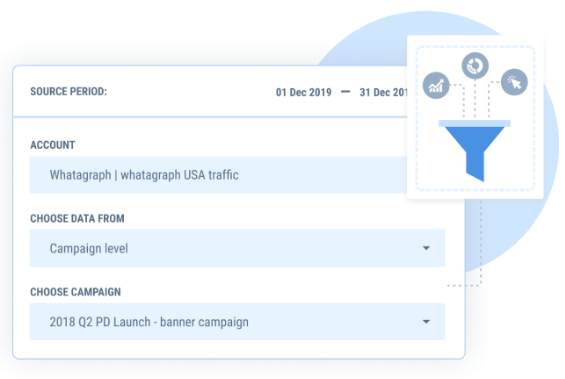
Filter your campaigns
Reporting periods as flexible as never before. Your single report will hold the data for several campaigns within different date ranges – for extremely flexible marketing campaign reporting.
Add data from sources not yet supported by our API
With Whatagraph’s powerful CSV/Excel file import, you can add marketing analytics data from virtually any source. Build holistic and easy-to-read KPI reports that encompass all your channels, and get a clear sense of your business performance.
Mobile Accessibility
This fantastic application is available on mobile devices and across platforms such as Android as well as iOS. This feature makes it more flexible and convenient to use when you are on the go.
Whatagraph Review: Integration
Whatagraph integrates with your Facebook profiles integrating your Facebook business pages to keep you updated.

Additionally, it also integrates with your Google Analytics Site to report on its performance. Broadly, platform on which it integrates are:
- Twitter( Coming soon), and
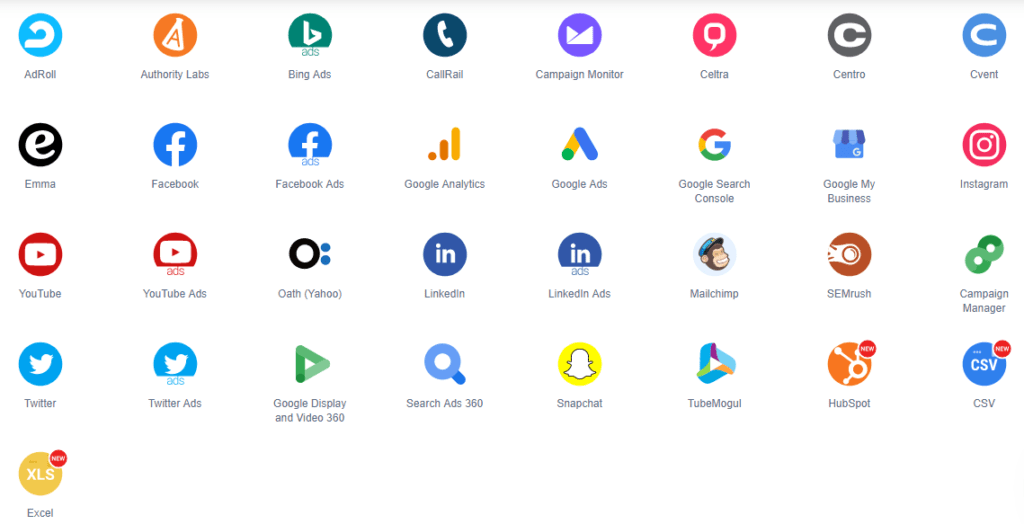
Whatagraph Review: Data Source
Whatagraph integrates with thousands of data sources. See image below. Also in their own words, they also have the following features in store with the integrations:
Automated multi-source reports
Keep your clients up to date with a report delivered straight to their inbox anytime you want. This way you can effortlessly provide automated weekly, monthly or even quarterly reports.
The most visual white-labelled reports
Upload your logo; build a custom color scheme for your report to match your agency or business brand. This way your reports will look cooler than ever and will be easily recognizable everywhere.
Made for agencies, loved by businesses
We will make you fall in love with data with our multi-campaign reporting. Show and present your campaign’s performance using user-friendly reports.
Whatagraph Review: Support
Whatagraph offers a powerful online chat support. Users can chat right inside the account to resolve any issues. The chat section inside the account also helps through a short and informative video about the product.
Whatagraph Review: Versions
Whatagraph for agencies
We’re a perfect tool for agency reporting since we provide fully automated reports with your agency’s branding and even have some premium features.
Whatagraph for businesses
We’re an irreplaceable reporting tool that’s often used in a company for social media, organic search, and other digital marketing reporting.
Whatagraph for marketers
Whether you’re a freelancer, or working within a company, showing your results is always a great idea. Especially in an understanding and visual way.

Whatagraph Pricing Plans
| Pricing Plans | |
| Free Trial | 7 days |
| PROFESSIONAL | $99/month |
| PREMIUM | $229/month |
| ENTERPRISE | $450/month |
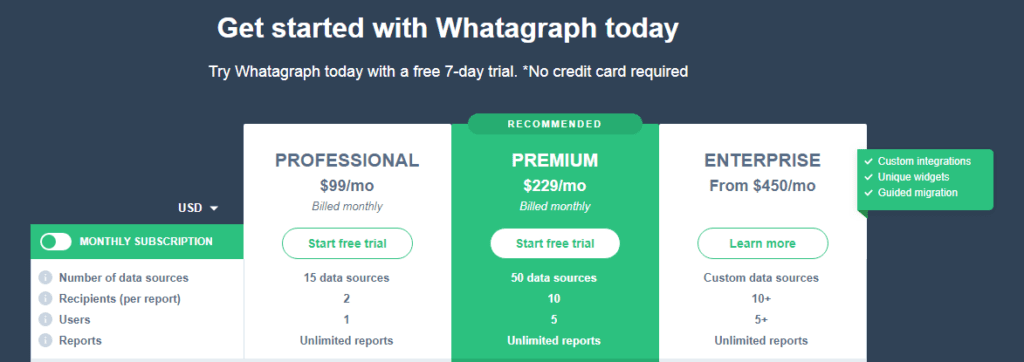
Whatagraph offers three enterprise pricing plans for users to choose from. Give the details a look, and select the best option for your company:
Pro – $30/month
- 3 free data sources
- Add additional source for $5/month
- Basic web performance metrics
- Overview of social media channels
- Automated reports for 5 recipients
- 1 user
- Email support
Business – $70/month
- 10 free data sources
- Add additional source for $5/month
- Advanced web performance metrics
- Overview of social media channels
- Custom data widgets
- Report customisation
- Automated reports for 10 recipients
- 1 user + add additional users for $10/month
- Email and live chat support
Agency – $450/month
- 50 free data sources
- Add additional source for $5/month
- All Business features
- Custom report and email branding
- Unlimited report automation
- 5 users + add additional users for $10/month
- Dedicated account manager and live chat support
Whatagraph Review: Competitors and Alternatives
Megalytic: Megalytic is a web-based data collection solution that gathers data from various sources of information and transforms them into different formats, from traditional spreadsheets and CSV files to very beautiful and customized charts, graphs, and maps. The data can be easily assembled to reports that are tailored to suit the preference of the receiver, be it the marketing team, web content editors, and senior management officials.
Megalytic is built to be fast, reliable, and user-friendly. In fact, it is so easy to use that creating reports doesn’t have to be delegated to the data analytics teams – users can easily make their own custom reports. Based on pre-set permissions, users can share reports with other team members, senior officers, and other people within the organization.
Simply Measured: Simply Measured is a social media analytics platform that simplifies end-to-end analysis of all social network activities of its users, whether it’s paid, owned, or earned. Insights are derived from the all the information gathered and then sent in exact formats set by its users, whether that’s on the web, in dynamic Excel reports, or in PowerPoint.
Simply Measured is widely used by small businesses, large corporations and every company in between. It provides them social media analytics to measure their social media performance, online campaigns, etc., monitor online mentions of specific keywords, and set triggers for specific instances. Implemented by known global brands including Adidas, Microsoft and Samsung to name a few, Simply Measured makes making informed decisions a lot easier, which then ultimately leads to exceptional results.
Supermetrics: Supermetrics is a business analytics software that puts all your metrics and performance indicators in a unified, very accessible location. Initially designed to help companies simplify their access to their Google Analytics data, Supermetrics has evolved to become a full-blown business reporting platform that works with various analytics engine and tool. The software has become an ideal platform to gather data and insights to help devise and implement web analytics, social media, and online marketing.
Supermetrics flagship product, the Supermetrics for Google Drive, enables businesses to run queries, refresh their data with just a push of a button, and effortlessly share reports and dashboards with other team members. Supermetrics Data Grabber delivers an Excel-based report automation application that can easily connect with a number of leading data sources like Google Analytics, AdWords, Facebook, Bing Ads, Twitter, and YouTube.
Supermetrics Uploader lets you import advertising expenses data from any source into Google Analytics. Supermetrics Functions is a tool designed for advanced Excel users. This module enables them to enter their business metrics painlessly into Excel and Google Spreadsheet for a more custom and detailed reporting.
Whatagraph Review: Summing Up
Analytics data can be hard to comprehend, especially for non-technical people who just want information delivered plainly to them. With Whatagraph, data presentation is a breeze. Information is visualized and laid out in a way that is easy to read and understand. And when you understand what your data means, you can easily come to the smartest business decisions and take immediate actions to drive business growth.
Whatagraph gathers data from more than 10 data sources without getting you involved in the process. The data gathering procedure is all automatic from start to finish and the system immediately makes sense of all the information it has received and turns them into readable reports. These reports are then automatically delivered to your inbox for you to read, analyse, and share. Imagine how much time and effort it will take you to perform the whole process. Clearly, you are saving a whole lot of time and sparing yourself from the headaches that come with data work and analysis.
When you need to analyse data based on a specific date range, you can do it with Whatagraph. The system does more than generating weekly and monthly reports. You can create custom date reporting by entering the date range that you specify. This gives you a great degree of flexibility you just can’t find and enjoy in other data visualization engines.
Marketing Analytics Reporting Software is fast-becoming a necessity for any company looking to advance in the increasingly competitive marketing and sales arenas, and Whatagraph is one of the most popular products available today.
Our 'Handpicked' Tools for Internet Mareters
- Native Advertising Software Tool: Brax, Anstrex
- Facebook Advertising Software Tool: Audiencer, Revealbot, Connectio,
- Social Media Advertising Software Tool: SproutSocial, SocialBee,
- Internet Marketing Software Tools: Semrush, SproutSocial,

I and my team research various media buying platforms and can help you choose the right network; so you could rake in more greenbacks with an increased ROAS. I am just a mail away, so reach out to me if you need assistance with scalable media buying. mail: [email protected]